Supported Widgets
Prerequisites for supported widgets
- Access to landing page widgets requires appropriate ARMS permissions. Ensure the following permissions are assigned to the user:
- bundle-inventory-management
- bundle-network-management
- inventory-viewer
- network-viewer
- aiops-viewer
- Account has to be subscribed to have Kyndryl Managed Network Services (KMNS) Catalog Service.
- To subscribe for the Catalog Service, follow these steps:
- Launch Kyndryl Bridge.
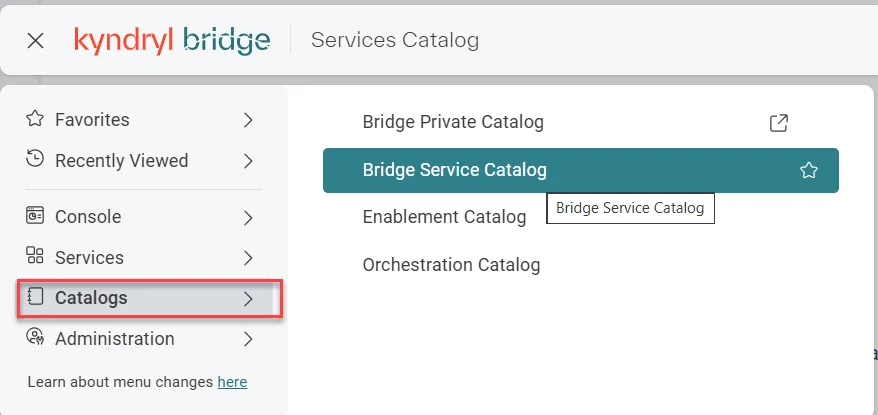
- From the navigation menu, click Catalogs > Bridge Service Catalog as shown in the image below:
- On the loaded page, select Network and Edge.
- Click View All to display all the available services.
- Select Kyndryl Managed Network Services.
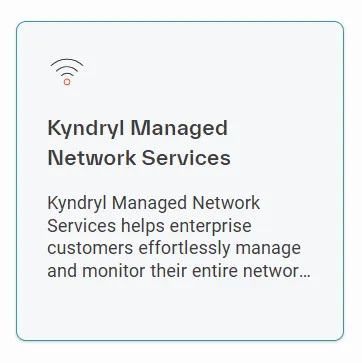
- The Kyndryl Managed Network Services Overview page opens.
For detailed subscription instructions, refer to the Subscriptions documentation:
Without these permissions, users may not be able to view or interact with the corresponding KMNS widgets.
F1 dashboard widgets
The F1 dashboard widgets are displayed on the Console landing page. To navigate to Console page:
- Launch Kyndryl Bridge.
- From the navigation menu, click Console > Bridge Home.
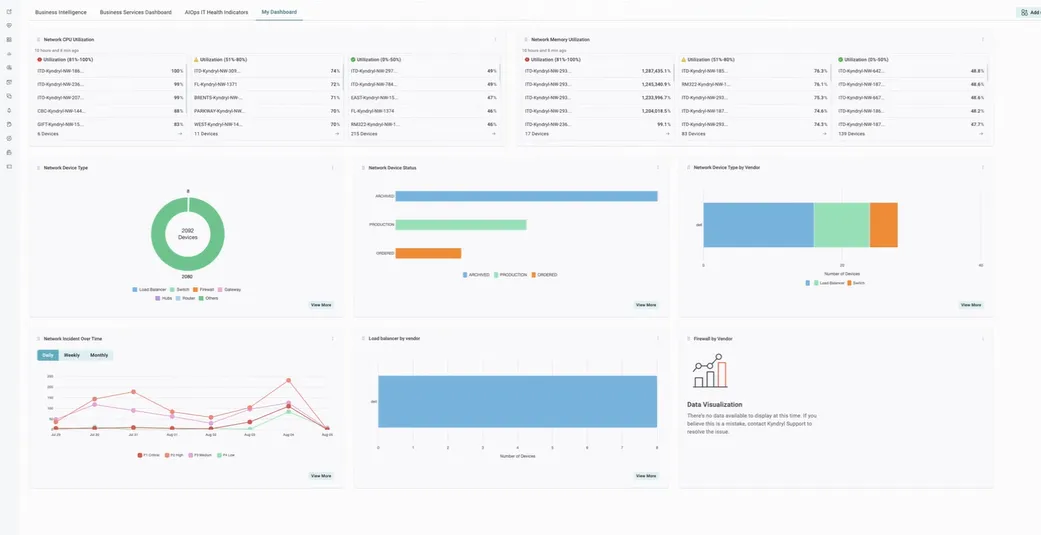
Widgets are available within the My Dashboard tab, which serves as the default bridge console upon login. This section allows users to personalize their workspace based on their roles and preferences by selecting, arranging, and saving widgets as needed.
Users can add widgets by clicking the Add widgets icon  opening the Widgets panel, and dragging the required widgets onto the dashboard canvas. The selected layout and configurations are saved automatically for future sessions.
Widget description
The following widgests are supported:
- My Dashboard Widgets: This list contains all supported widgets for the My Dashboard console.
- Network CPU Utilization: Displays CPU utilization for all network devices by severity:
- Red: Critical – 81% to 100%
- Amber – 51% to 80%
- Green – 0% to 50%
- Network Memory Utilization: Displays memory utilization for all network devices by severity:
- Red: Critical – 81% to 100%
- Amber – 51% to 80%
- Green – 0% to 50%
- Create Incidents Over Time Widget: The Incident Over Time Widget provides a visual representation of incidents tracked over a defined time. It allows users to monitor trends, compare severity levels, and identify spikes or patterns in incident occurrences. Provides a visual representation of incidents tracked over a defined time period:
Time period | Description |
|---|---|
Daily | Displays daily recorded incidents over a selected time period. |
Weekly | Displays weekly recorded incidents over a selected time period. |
Monthly | Displays monthly recorded incidents over a selected time period. |
Provides different colored lines to represent incident priority levels:
Indicator | Priority level | Severity | Description |
|---|---|---|---|
🔴 | P1 | Critical | Highest priority, severe incidents requiring immediate action. |
🟠 | P2 | High | High-priority incidents needing urgent attention. |
🟣 | P3 | Medium | Moderate impact incidents. |
🟢 | P4 | Low | Low-priority or minor incidents. |
Click View More for more details about this widget.
- Create Network Device Status Widget: Provides a quick summary of network device status and allows easy navigation. Displays the status of network devices in different stages as given below:
Color | Status type | Description |
|---|---|---|
🟦 Light Blue | Planned | Devices planned for future deployment or implementation. |
🟩 Light Green | Production | Devices currently active in the production environment. |
🟧 Orange | Archived | Devices that are no longer actively used and have been archived. |
| In Stock | Devices available in inventory and ready for deployment. |
🟪 Purple | Idle | Devices that are currently not assigned or in use. |
🟨 Yellow | Others | Devices categorized outside the standard status groups. |

Click View More for more details about this widget.
- Create Network Device Type Widget: Provides a graphical overview of the distribution of devices across different network categories. It also displays the number of network device type by vendors. The widget uses a donut chart with different colours to help users quickly understand the number and proportion of devices within the environment.
Color | Device type | Description |
|---|---|---|
🟦 Blue | Firewall | Security devices that monitor and control network traffic. |
🟩 Green | Switch | Devices used to connect systems within a network. |
🟧 Orange | Router | Devices that route network traffic between networks. |
| Load Balancer | Devices used to distribute workloads across resources. |
🟪 Purple | Gateway | Devices that connect networks using different protocols. |
⬜ Light Gray | Hubs | Basic networking devices used to connect multiple systems. |
🟩 Light Green | Others | Devices that do not belong to predefined categories. |
Click View More for more details about this widget.
- Display Network Device Type By Vendor: Provides visibility into the total number of devices available for each listed vendor as shown below:
Color indicator | Color name | Device type | Description |
|---|---|---|---|
🟦 | Light Blue | Firewall | Security devices that monitor and control network traffic |
🟩 | Light Green | Switch | Devices used to connect systems within a network |
🟧 | Orange | Router | Devices that route traffic between different networks> |
| Pink | Firewalls & Security Appliances | Advanced security devices combining firewall and additional protections |
🟪 | Purple | Wireless Access Point | Devices that provide wireless network connectivity |
🟨 | Yellow | Others | Devices that do not fall into standard categories |
- Display Firewalls by Vendor: Provides visibility into vendor diversity, sprawl, and technology standardization. The horizontal bar chart shows the number of network devices by firewall vendor as shown below:
Vendor | Firewall devices | Color indicator | Notes |
|---|---|---|---|
🟦 Fortinet | 4747 devices | Light Blue | Highest number of firewall devices (dominant in chart) |
🟪 Cisco | Very low (small bar) | Purple | Minimal firewall presence compared to Fortinet |
🟨 IBM | Near zero | Yellow | Negligible or no visible firewall count |
🟧 Fortigate | Near zero | Orange | Very small or barely visible data |
- Display Load Balancer Vendors: Provides clear visibility into the distribution of technologies in use. Through a horizontal bar chart, users can view the number of network devices categorized by load balancer technology, helping identify vendor spread across the environment.
Color indicator | Vendor | Number of devices | Description |
|---|---|---|---|
🟦 | Cisco | 45 | Major contributor with the highest number of load balancers |
🟩 | F5 | ~2–3 | Minimal number of load balancer devices compared to Cisco |
- Network Utilization Dashboard The Utilization Dashboard provides detailed insights into CPU and Memory usage for network devices over a selected time period. It enables users to monitor performance trends, identify anomalies, and take proactive action.
- Network Incidents Over Time Detail Page The Incidents Over Time Detail Page provides a list of incidents and their details in a single view. Users can search, filter, and review incident information such as priority, device details, location, and status.
- Network Device Status Widget Details Page The table displays network device information in different columns:
Column name | Description |
|---|---|
Device Name | Displays the name of the network device. |
Type | Displays the category or type of device. |
Vendor | Displays the device manufacturer. |
Location | Displays the device location. |
Model | Displays the model number of the device. |
Serial Number | Displays the unique serial number of the device. |
Last Seen | Displays when the device was last detected by the system. |
Status | Displays the current operational status of the device. |