Monitoring - Reports
The Reports Dashboard transforms that information into meaningful insights, allowing you to move beyond reactive monitoring and gain a broader understanding of how your services are performing over time. By bringing reporting capabilities into a single experience, the dashboard helps you quickly identify opportunities for optimization, improve visibility, and make more confident decisions.
Use the Reports Dashboard to:
- Access operational and performance reports from a single location.
- Review historical and current network data to identify trends and patterns.
- Monitor key indicators that support service health, availability, and operational efficiency.
- Generate insights that help drive informed decisions, improve service quality, and support business outcomes.
- Share report findings with stakeholders to support planning, governance, and service reviews.
The dashboard also shows information about the latest data load and processing status, along with navigation links to related dashboards. You can choose from the available filters such as Customer Name, GSMA Code, Node Name, Device Type, and Interface Name, based on your requirements.
Features
The system provides comprehensive reporting capabilities for monitoring performance and availability metrics. The following reports are available:
- CPU & Memory Utilization – Displays processor and memory usage trends over the selected period.
- Node Availability – Indicates the operational status and uptime of monitored nodes.
- Interface Utilization – Shows traffic and utilization statistics for network interfaces.
- Disk Utilization – Reports storage usage and capacity trends for disks.
Note: All reports support time‑based filtering and can be downloaded for offline review or further analysis.
Refer to the following image for more details on Report Dashboard:
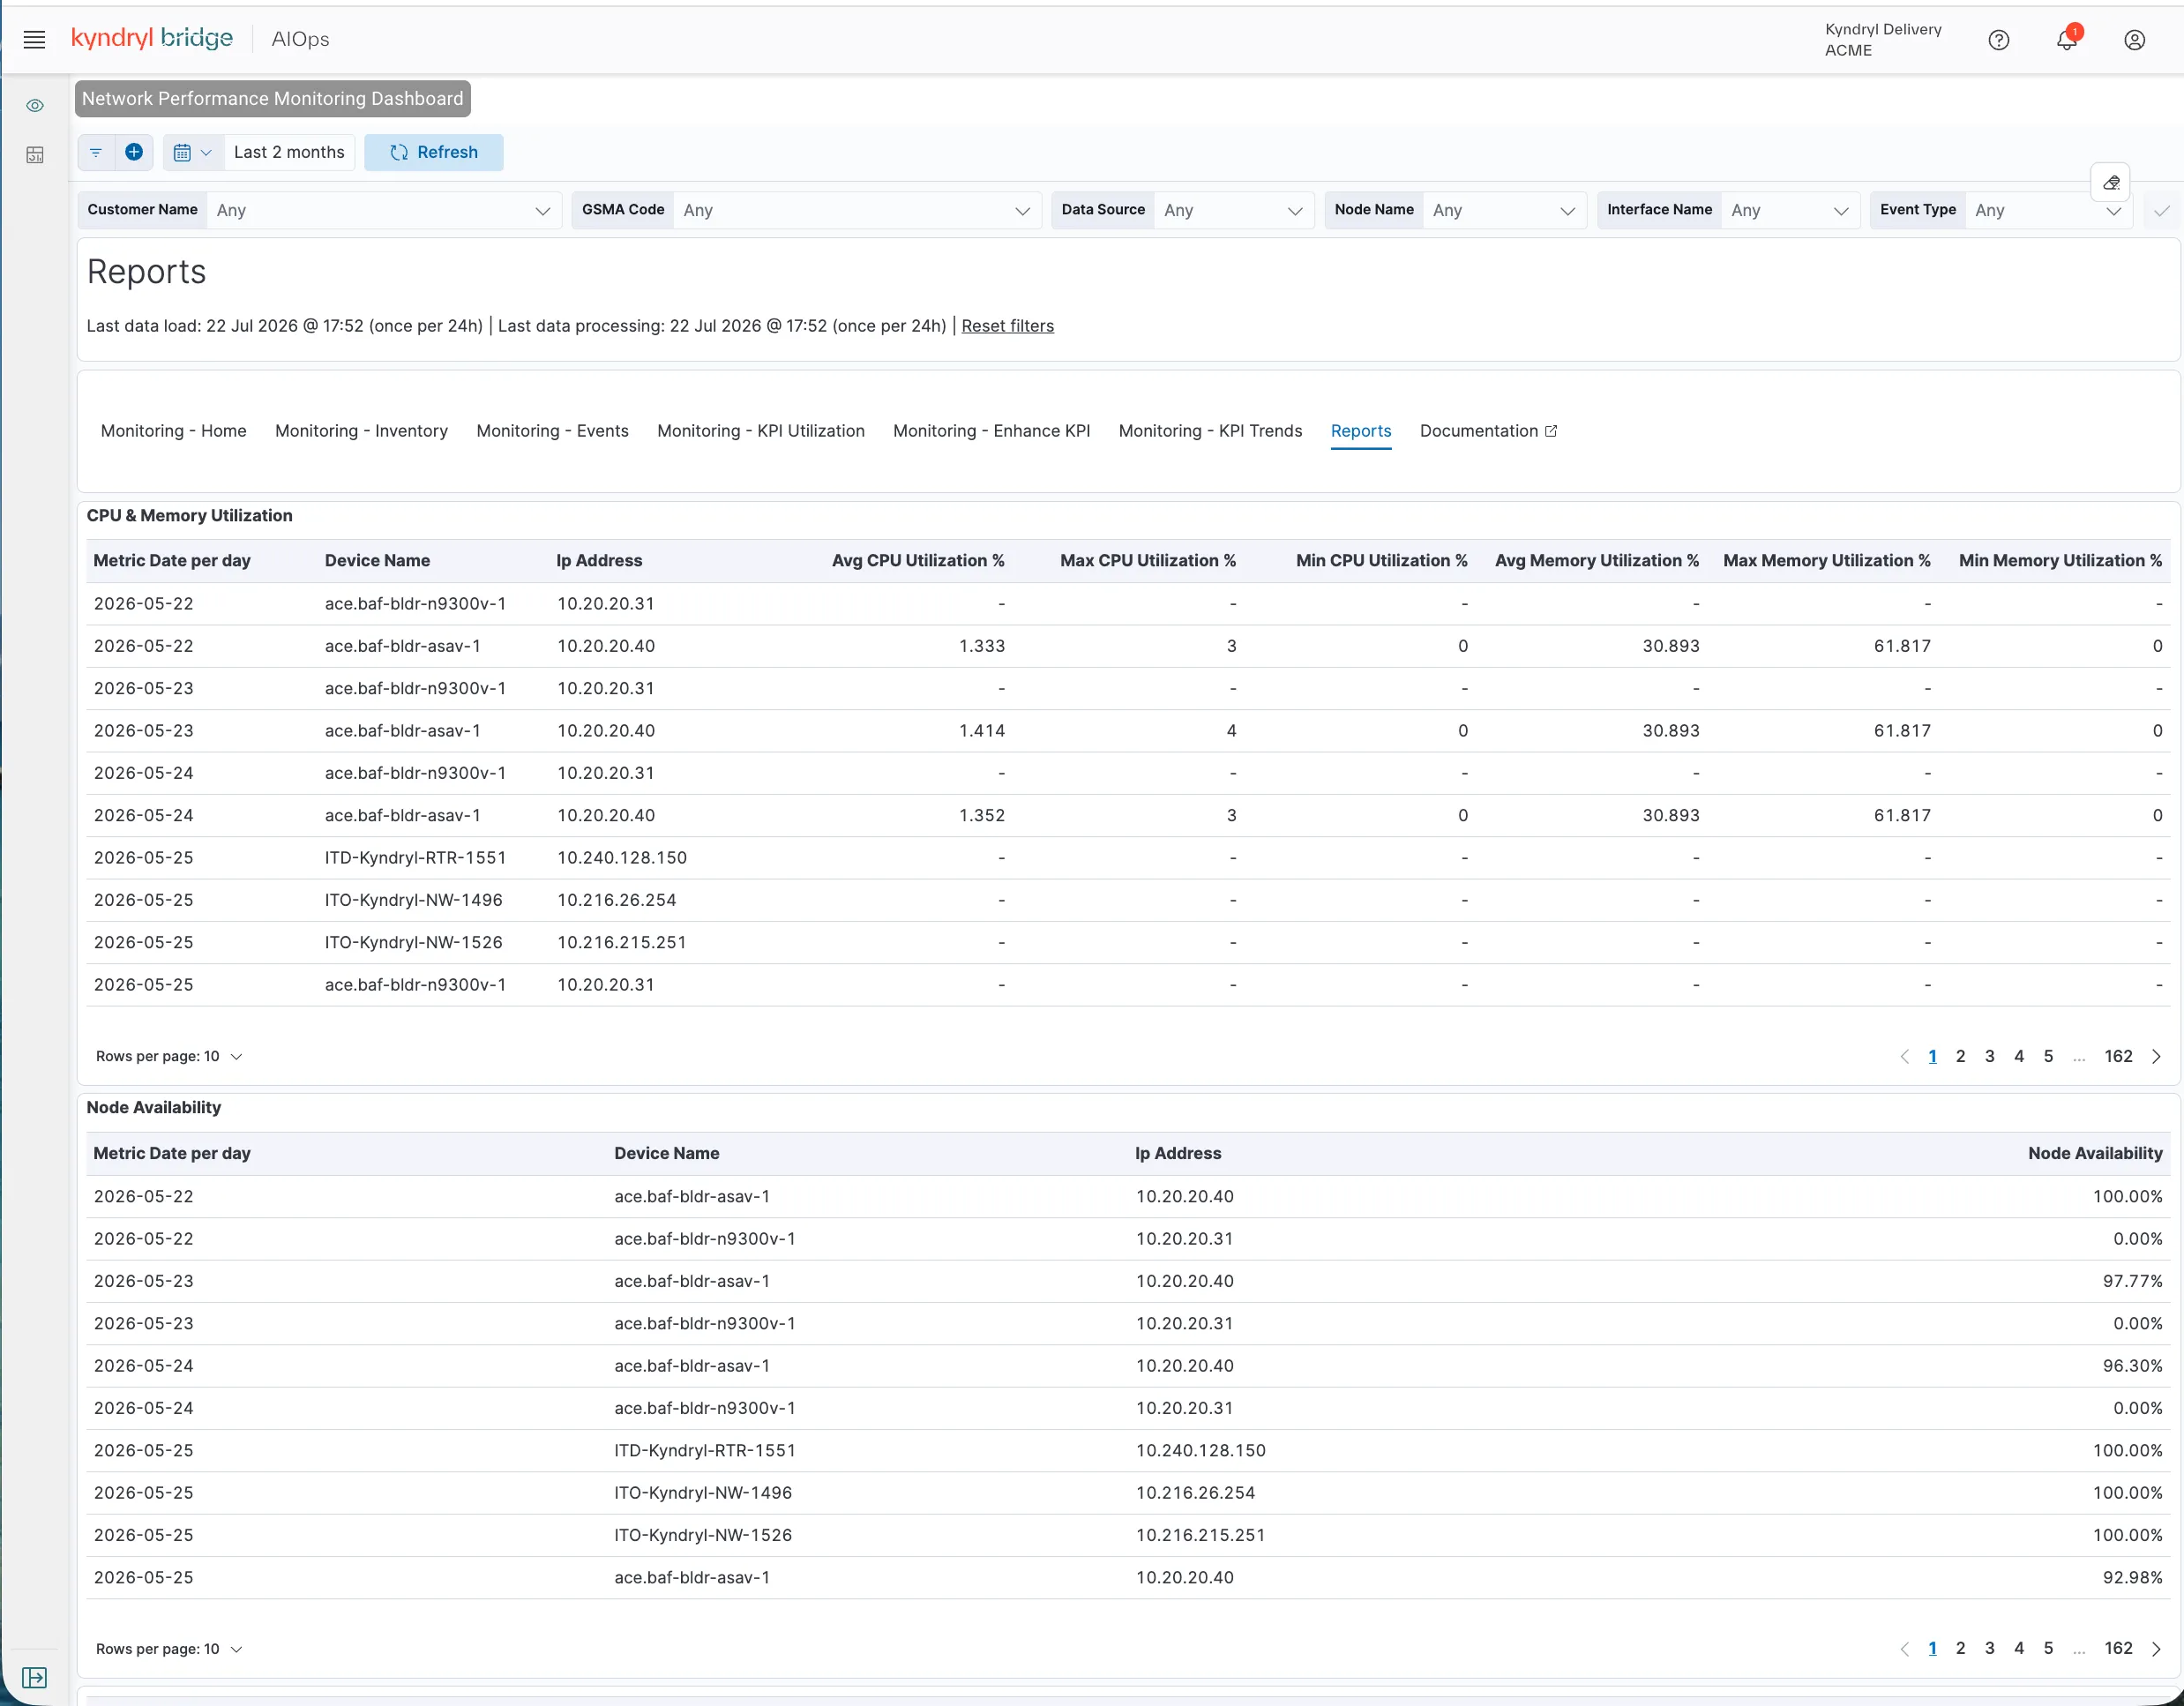
Access and download of Network Performance Reports
- Navigate to Kyndryl Bridge.
- Sign in using your authorized credentials.
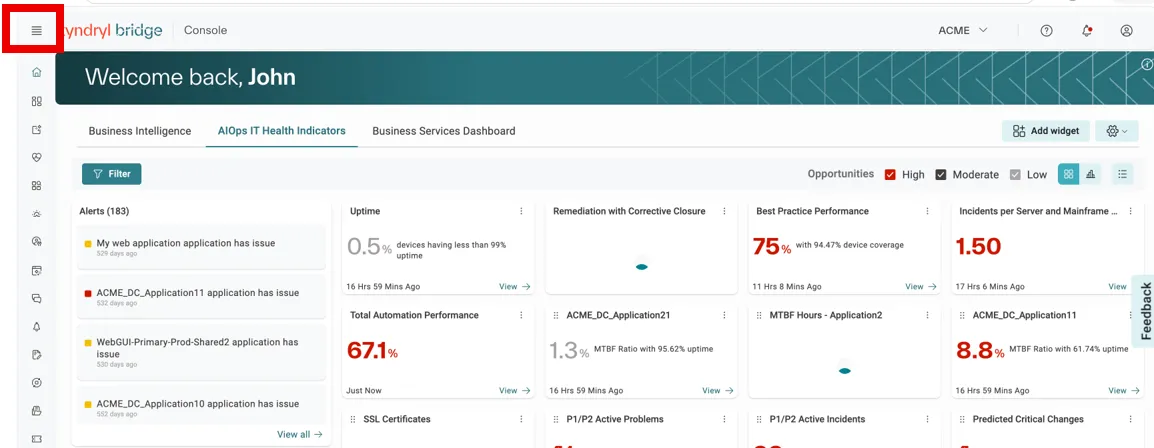
- From the main menu, select Services.
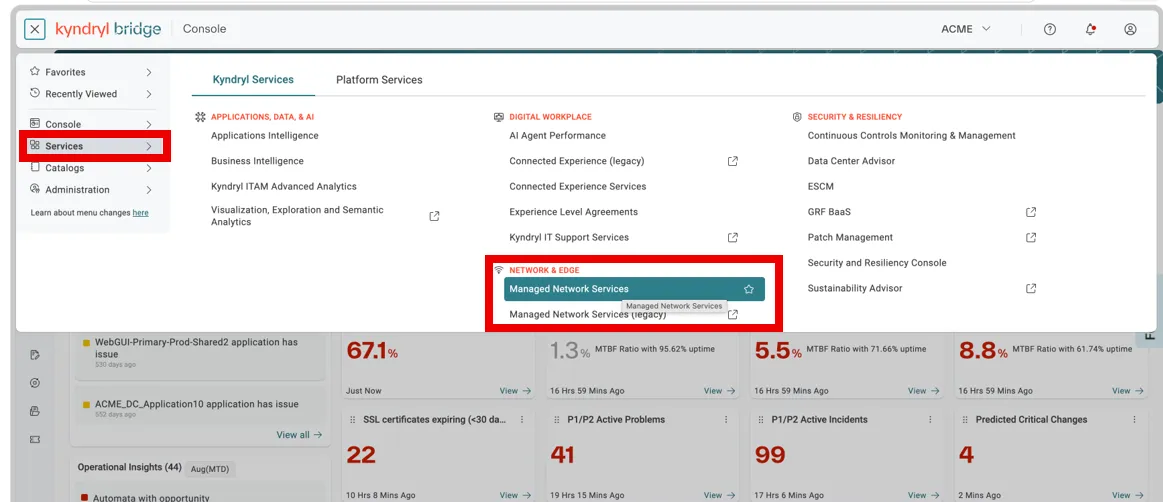
- SelectManaged Network Services.
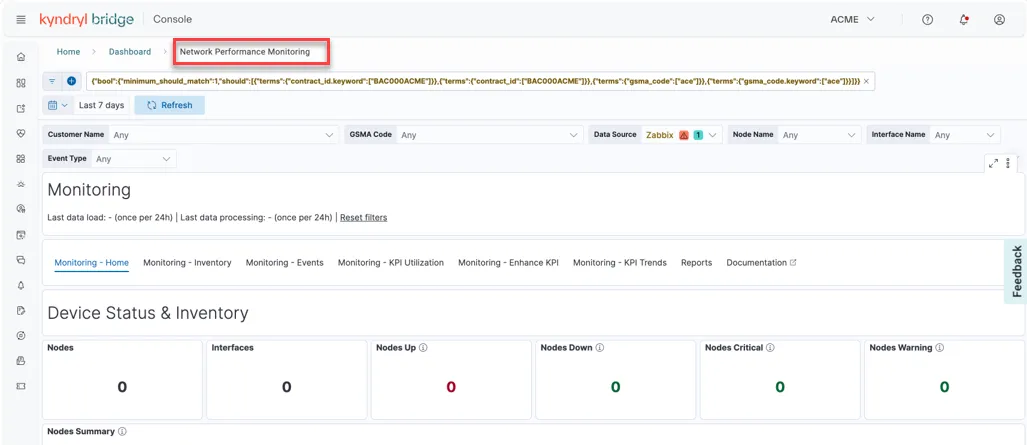
- In the left navigation pane, select Network Performance Dashboard.
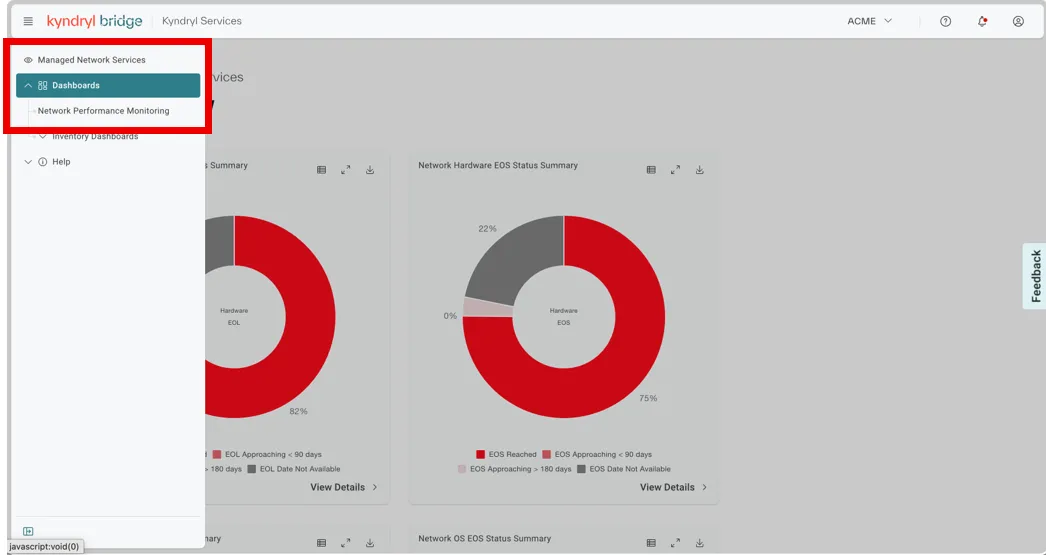
- Select Reports.
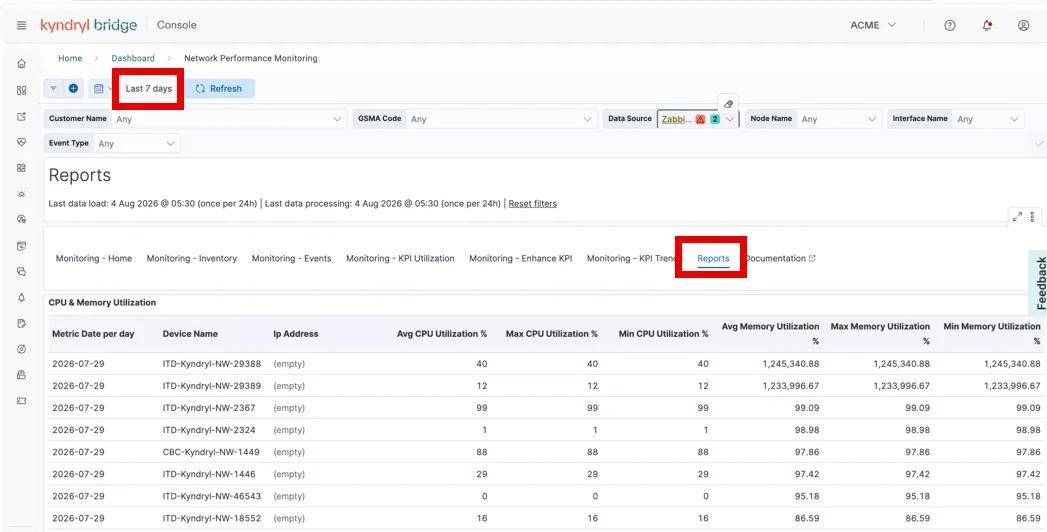
- Choose the required date range.
- Select the report that you want to generate.
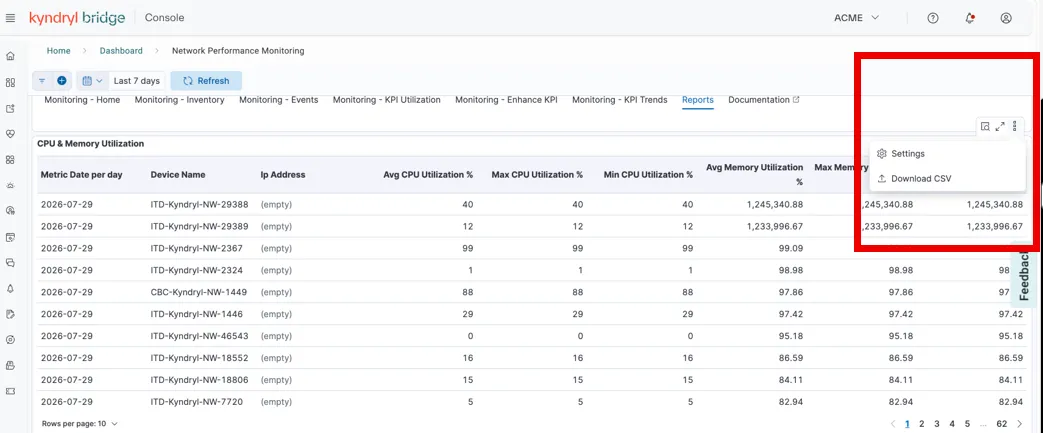
- After the report is generated, select Download.
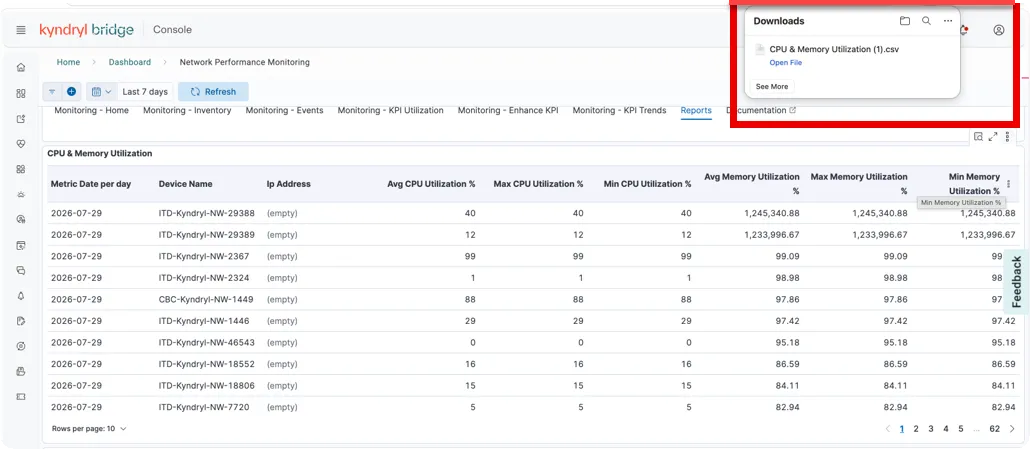
- Save the report to your local device.
- Repeat these steps for each report that you want to download.
Troubleshooting
Issue | Resolution |
|---|---|
Managed Network Services is not visible in Bridge | Verify that the KMNS Service Catalog subscription is active. |
Unable to access reports | Confirm that your Managed Network bundle access has been granted. |
Access request remains pending | Contact the designated DPE for approval status. |
Download option is unavailable | Verify that the report has been generated and that a valid date range is selected. |