Monitoring - KPI Utilization
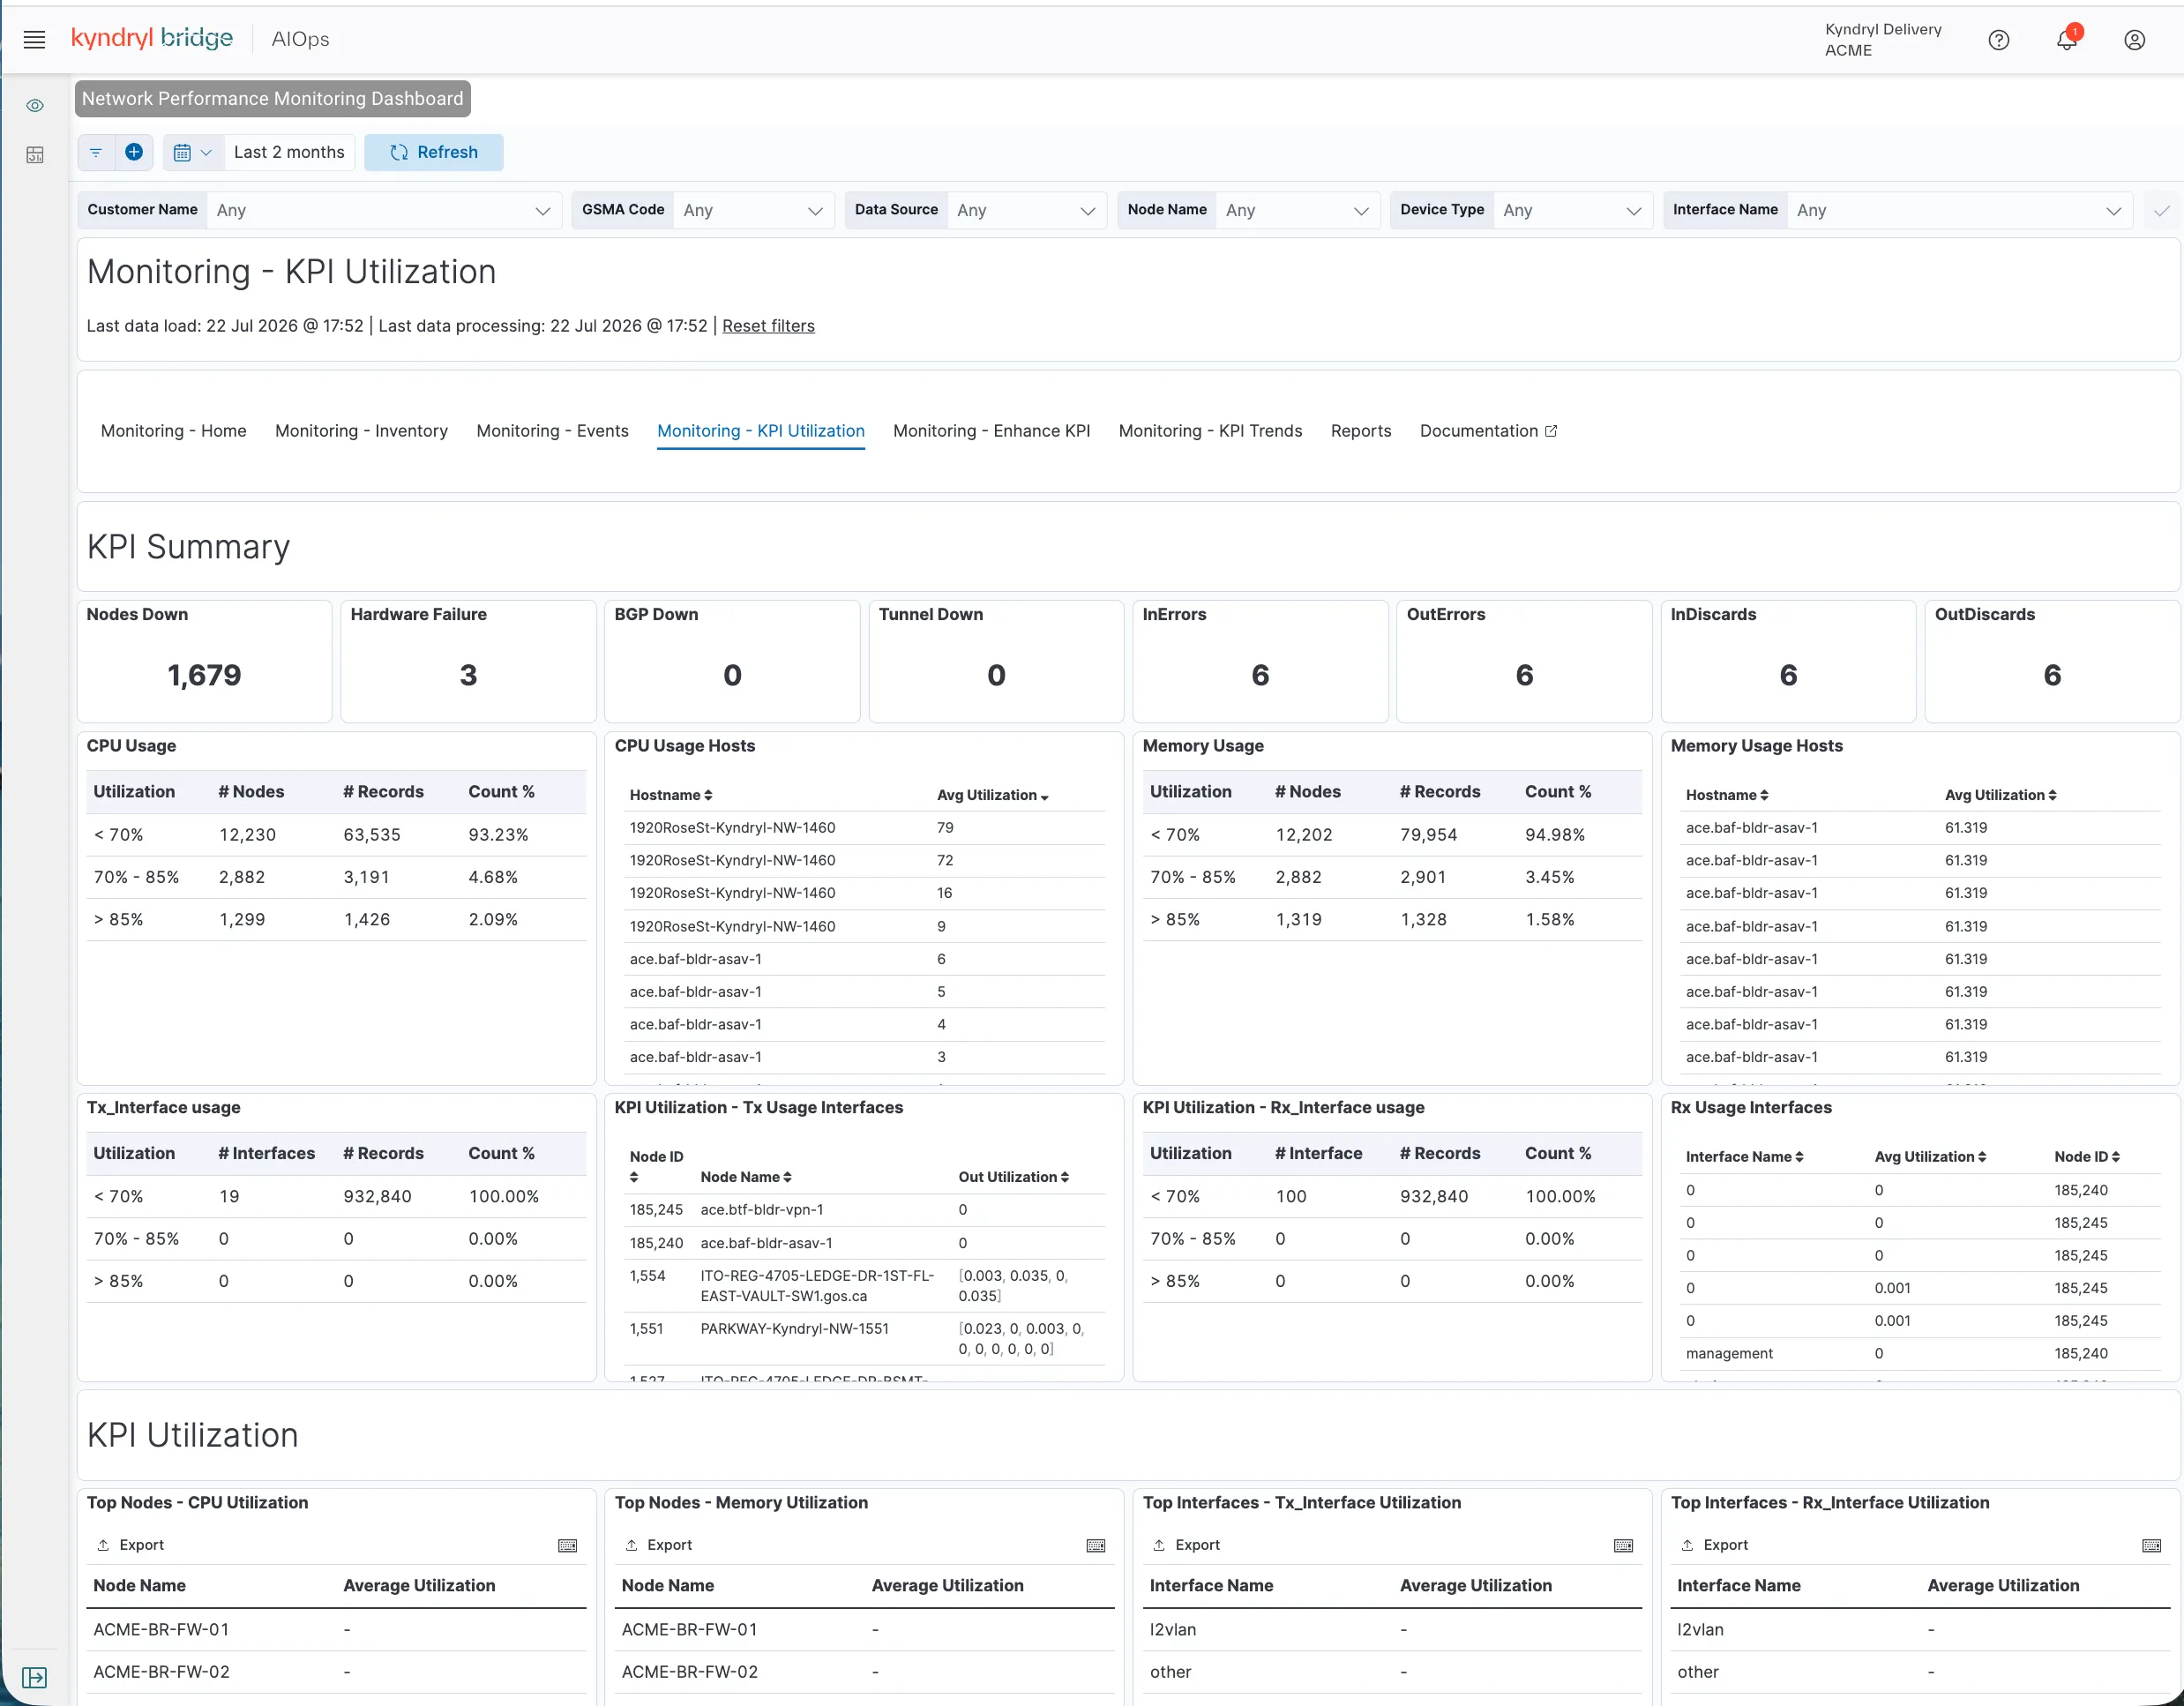
The Monitoring - KPI Utilization page provides data visualizations that help users understand KPIs associated with network devices. The page also includes a quick filter feature that enables users to narrow results without creating complex queries.
Filter parameters
The following filter parameters are available:
Filter Parameter | Description |
|---|---|
Customer Name | Filter devices owned by specific customers. |
GSMA Code | Filter devices associated with a specific GSMA code. |
Data Source | Filter by any supported data source used to monitor network devices and operating systems. |
Node Name | Filter by node name. |
Device Type | Filter by device type. |
Interface Name | Filter by a supported interface. |
Filter Options
Each parameter mentioned above supports the following boolean options:
Option | Description |
|---|---|
Include | Limit results to include the selected values. |
Exclude | Limit results to exclude the selected values. |
Visualization display options
Hover over the upper-right corner of a visualization to display the options menu (ellipsis icon). The following display options are supported:
Option | Description |
|---|---|
Settings | Apply a custom time range or configure additional visualization options. |
Inspect | Download a report. |
Maximize | Expand the visualization to display additional information. Select the control again to restore the visualization to its original size. |
Data visualizations
KPI summary
The KPI Summary section includes the following visualizations:
KPI Name | Description |
|---|---|
Nodes Down | Number of SolarWinds nodes that were down during the selected period. |
Hardware Failure | Number of devices reporting a critical hardware status. |
BGP Down | Number of devices reporting an idle state, indicating a BGP (Border Gateway Protocol) failure that prevents communication with peers. |
Tunnel Down | Number of tunnels that were down out of the total monitored tunnels. |
InErrors | Number of input errors reported on devices. |
OutErrors | Number of output errors reported on devices. |
InDiscards | Number of inbound packets discarded by devices. |
OutDiscards | Number of outbound packets discarded by devices. |
CPU and memory utilization
This section is classified into the following:
- CPU Usage
- CPU Usage Hosts
- Memory Usage
- Memory Usage Hosts
Utilization Type | View | Utilization Category | Number of Devices (Nodes) | Number of Associated Records | Percentage of Total Devices | Description / Identifier |
|---|---|---|---|---|---|---|
CPU Usage | Distribution | Less than 70% | Yes | Yes | Yes | CPU utilization distribution across devices. |
CPU Usage | Distribution | 70%–85% | Yes | Yes | Yes | CPU utilization distribution across devices. |
CPU Usage | Distribution | Greater than 85% | Yes | Yes | Yes | CPU utilization distribution across devices. |
CPU Usage Hosts | Host-Level | N/A | No | No | No | CPU utilization per host, identified by hostname. |
Memory Usage | Distribution | Less than 70% | Yes | Yes | Yes | Memory utilization distribution across devices. |
Memory Usage | Distribution | 70%–85% | Yes | Yes | Yes | Memory utilization distribution across devices. |
Memory Usage | Distribution | Greater than 85% | Yes | Yes | Yes | Memory utilization distribution across devices. |
Memory Usage Hosts | Host-Level | N/A | No | No | No | Memory utilization per host, identified by hostname. |
| | | | | | |
Interface utilization
The Interface utilization section includes the following:
Report / Table Name | Description | Metrics Included | Utilization Categories |
|---|---|---|---|
Tx_Interface Usage | Table showing outbound interface utilization. | Number of interfaces, Number of associated records | Less than 70% Between 70% and 85% Greater than 85% |
Tx_Interface Details | Table providing outbound interface communication details. | Number of interfaces, Number of associated records | Less than 70%, Between 70% and 85% Greater than 85% |
SolarWinds KPIUtilization – TX Usage Interfaces | Table providing details about nodes with outbound communications monitored by SolarWinds. | Node/interface utilization details | Not specified |
SolarWinds KPIUtilization – RX Interfaces | Table providing inbound interface communication details. | Number of interfaces, Number of associated records | Less than 70%, Between 70% and 85% Greater than 85% |
RX Usage Interfaces | Table providing details for all nodes engaged in inbound communications. | Inbound communication/interface details | Not specified |
| | | |
KPI utilization
The KPI Utilization section includes the following visualizations:
KPI Name | Description |
|---|---|
Top Nodes – CPU Utilization | List of nodes ranked in descending order by CPU utilization. |
Top Nodes – Memory Utilization | List of nodes ranked in descending order by memory utilization. |
Top Interfaces – TX Interface Utilization | List of interfaces ranked in descending order by outbound communication (transmit traffic). |
Top Interfaces – RX Interface Utilization | List of interfaces ranked in descending order by inbound communication (receive traffic). |
KPI status
The KPI status section includes the following categories:
KPI Name | Description |
|---|---|
Top Nodes by Node Down | List of all nodes ranked by the number of downtime occurrences in descending order. |
Top Interfaces by Interface Down | List of all interfaces ranked by the number of downtime occurrences in descending order. |
Top Nodes by BGP Down | List of all nodes in an idle state, indicating a BGP (Border Gateway Protocol) failure, ranked by the number of idle occurrences in descending order. |
Top Nodes by Tunnel Down | List of all tunnels ranked by the number of downtime occurrences in descending order. |
SolarWinds KPI Utilization – Interface In Errors | List of all interfaces showing the average number of inbound errors. |
Interface Out Errors | List of all interfaces showing the average number of outbound errors. |
Interface In Discards | List of all interfaces showing the average number of inbound discards. |
Interface Out Discards | List of all interfaces showing the average number of outbound discards. |
CPU Usage by Hour | Scatter chart displaying node CPU usage at specific timestamps. |
Memory Usage | Scatter chart displaying node memory usage at specific timestamps. |
TX Interface Usage | Scatter chart displaying outbound interface communication activity at specific timestamps. |
RX Interface Usage | Scatter chart displaying inbound interface communication activity at specific timestamps. |
KPI trends
All charts include filters that allow users to show or hide specific data elements. For example, on a chart displaying both inbound and outbound interface discards, users can choose to display either metric independently or both together.
Visualization / Chart Title | Chart Type | Metrics Tracked | Description |
|---|---|---|---|
CPU & Memory Usage | Trendline | CPU Utilization, Memory Utilization | Displays overall system resource utilization trends over time. |
TX Interface & RX Interface | Trendline | Outbound Traffic (TX), Inbound Traffic (RX) | Tracks network interface communication volume and bandwidth direction over time. |
SolarWinds KPI Utilization – Interface In & Out Errors | Trendline | Inbound Errors, Outbound Errors | Monitors physical and logical interface transmission errors over time. |
SolarWinds KPI Utilization – Interface In & Out Discards | Trendline | Inbound Discards, Outbound Discards | Shows inbound and outbound packet drops across network interfaces over time. |
SolarWinds KPI Utilization – KPI Status – Node | Trendline | Node Down Occurrences | Tracks network device downtime and failure events over time. |
SolarWinds KPI Utilization – KPI Status – Interface | Trendline | Interface Down Occurrences | Displays interface status failures and connection drops over time. |
SolarWinds KPI Utilization – BGP Status | Trendline | Idle BGP Occurrences | Tracks BGP protocol failures and peer disconnect occurrences over time. |
SolarWinds KPI Utilization – Tunnel Status | Trendline | Tunnel Downtime | Monitors VPN and network tunnel outages and downtime events over time. |
| | | |
Refer to the following image for more details on KPI Utilization: