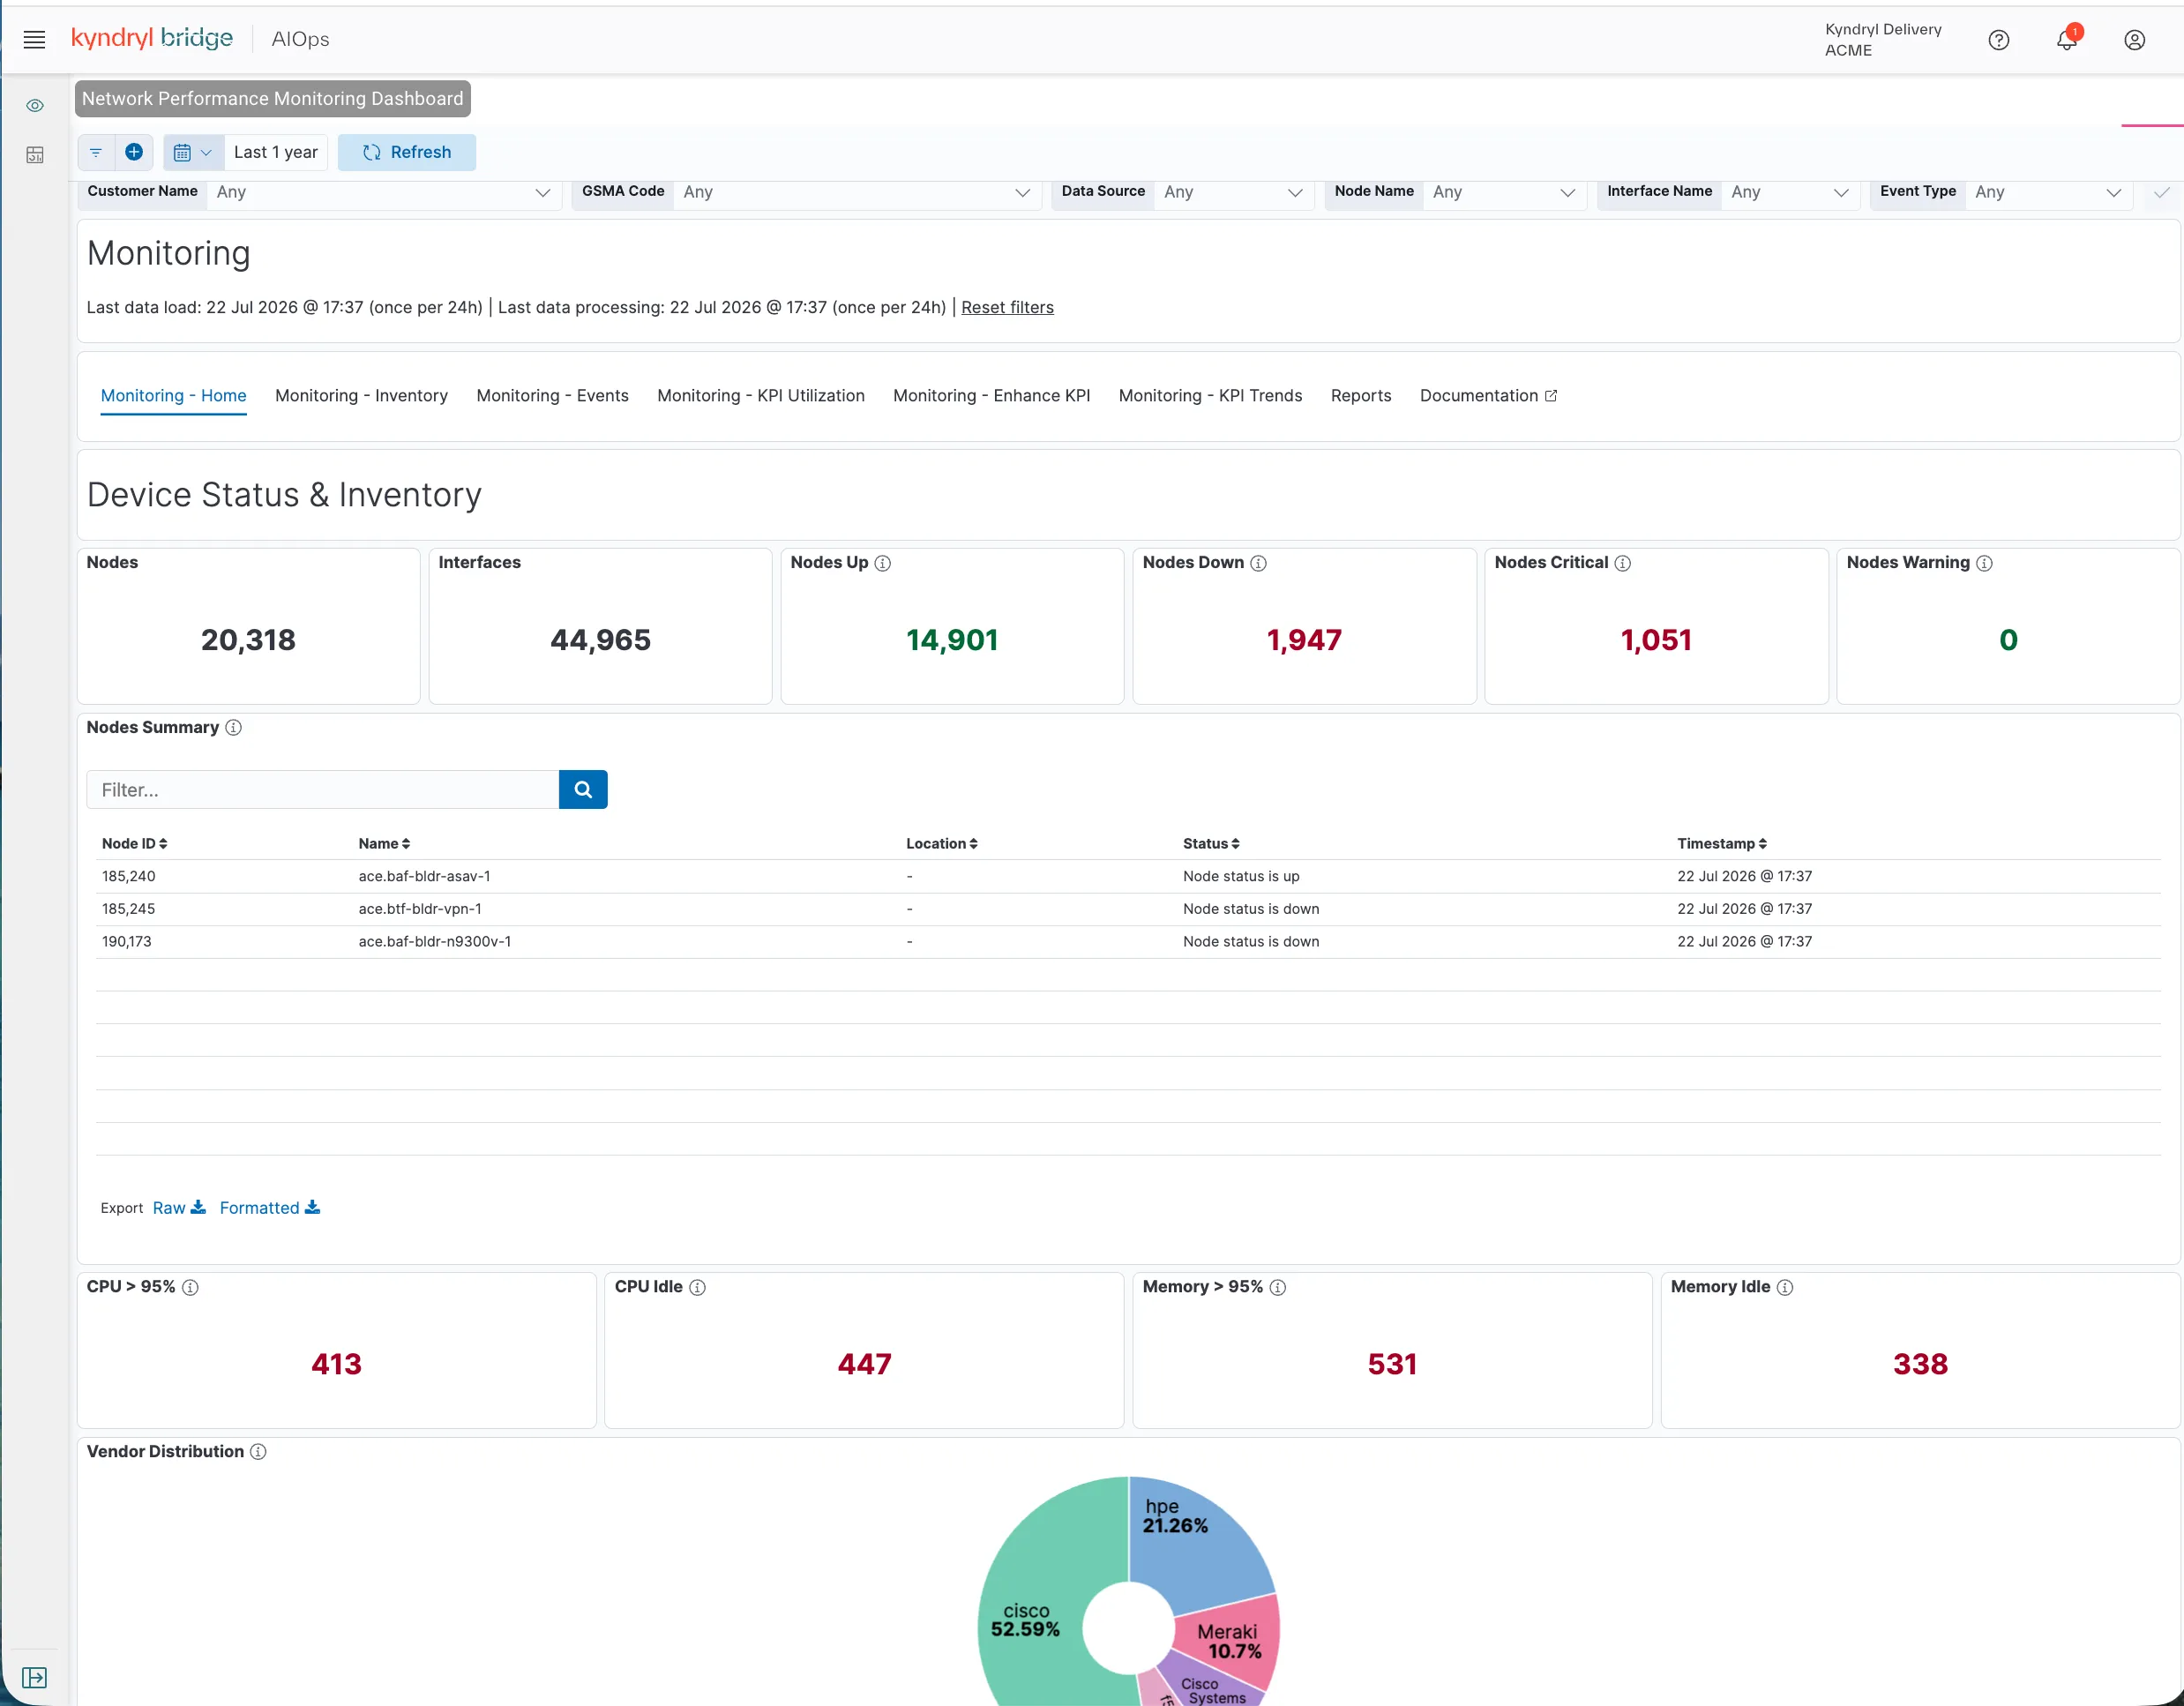
Monitoring - Home
The Monitoring - Home page presents data visualizations that enable an understanding of network device and KPI status. It is the default page provided by the service when you navigate to the Network Performance Monitoring Dashboard.
Global filters
In addition to data visualizations, the page provides a global filter to enable the narrowing of data without complex queries. Parameters include the following:
Filter Parameter | Description |
|---|---|
Customer Name | Devices owned by a specific customer. |
GSMA Code | Devices associated with a specific GSMA code. |
Data Source | Any supported data source used to track network devices and operating systems. |
Node Name | Specify a node by name. |
Interface Name | Specify a supported interface. |
Event Type | Specify a supported interface. |
Include / Exclude Filtering Options
Each filter parameter supports the following Boolean options:
Option | Function |
|---|---|
Include | Displays only records that match the selected filter value(s). |
Exclude | Removes records that match the selected filter value(s) from the results. |
Visualization Display Options
Hover over the right upper corner to to present the display options icon (elipsis). The following display options for the visualization are supported:
Display Option | Description |
|---|---|
Settings | Apply a custom time range or other options. |
Inspect | View detailed data behind the visualization and download a report. |
Maximize / Minimize | Enlarge the visualization to see more information. The control toggles to Minimize. |
Data visualization
The page presents the following data visualizations:
Device status and history
Metric | Description |
|---|---|
Nodes | The number of devices connected to SolarWinds. |
Interfaces | The number of interfaces monitored by SolarWinds. |
Nodes Up | The number of SolarWinds nodes that were up during the selected time range. |
Nodes Down | The number of SolarWinds nodes that were down during the selected time range. |
Nodes Critical | The number of SolarWinds nodes that were in a Critical status during the selected time range. |
Nodes Warning | The number of SolarWinds nodes that were in a Warning status during the selected time range. |
Nodes Summary | A tabular list of SolarWinds nodes, including details and the current status of each node. |
CPU > 95% | The number of devices that exceeded 95% CPU utilization during the selected time range. |
CPU Idle | The number of devices with idle CPU during the selected time range. |
Memory > 95% | The number of devices that exceeded 95% memory utilization during the selected time range. |
Memory Idle | The number of devices with idle memory during the selected time range. |
Vendor Distribution | A donut chart showing the top five device vendors on the network by device count. |
| |
Component status
Metric / Visualization | Description |
|---|---|
Event Counts | The total number of unique events that occurred during the selected time range. |
Top 10 Contributing Events | A bar chart showing the top 10 event types by event count during the selected time range. |
Top 10 Contributing Nodes | A bar chart showing the top 10 nodes that generated the highest number of events during the selected time range. |
Nodes Contributing to Events | The number of nodes generating events. |
Interfaces Contributing to Events | The number of interfaces generating events. |
KPI utilization status
Metric / Visualization | Description | Categories / Details |
|---|---|---|
Hardware Failure | The number of devices with a critical hardware status. | N/A |
RX Interface Usage | A bar chart showing the number of interfaces by Rx utilization percentage. | Less than 70%, Between 70% and 85%, Greater than 85% |
CPU Usage | A bar chart showing the number of devices by CPU utilization percentage. | Less than 70%, Between 70% and 85%, Greater than 85% |
Nodes Down | The number of nodes that have experienced a node-down event. | N/A |
BGP Down | The number of devices reporting an idle BGP (Border Gateway Protocol) state, indicating a failure to communicate with peers. | N/A |
TX Interfaces Usage | A bar chart showing the number of interfaces by Tx utilization percentage. | Less than 70%, Between 70% and 85%, Greater than 85% |
Memory Usage | A bar chart showing the number of devices by memory utilization percentage. | Less than 70%, Between 70% and 85%, Greater than 85% |
Tunnel Down | Of the 121 tunnels, the number that were down during the selected time range. | N/A |
Hardware Summary | A tabular summary of network devices, including identifying details and current status. | N/A |
Refer to the image below: