Managed Network Services landing page
The Managed Network Services landing page presents the Network Inventory dashboard containing critical data regarding the status of your network devices, and the operating systems pertaining to them. Navigate to the landing page as follows:
From the Kyndryl Bridge main menu  , go to Services → Kyndryl Services → Managed Network Services.
The dashboard displays details of Insights and Data Table in the Kyndryl Bridge dashboard for Network and Edge management, which provides visibility into device inventory, network health, compliance metrics, and life-cycle management.
Refer to the following table for user permissions and entitlement mapping details:
ID | Email domain | Audience | KMNS entitlement | Internal User | View rights | Edit rights |
|---|---|---|---|---|---|---|
P1 | @kyndryl.com | Internal | kmns-account-viewer or iaiops.network-account.view | True | True | False |
P2 | @kyndryl.com | Internal | kmns-account-operator or iaiops.network-account.edit | True | True | True |
P3 | @kyndryl.com | Internal | kmns-account-administrator or iaiops.network-account.administer | True | True | True |
P4 | non-Kyndryl | External | kmns-account-viewer | False | True | False |
P5 | non-Kyndryl | External | none | False | False | False |
Insights
Dashboard overview metrics cards
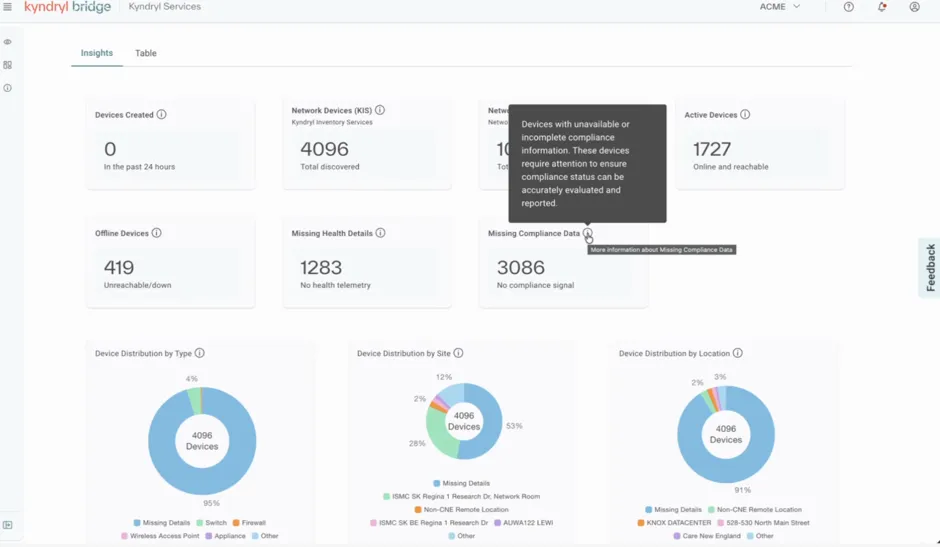
The top section of the Insights tab displays high-level health and operational metrics:
- Devices Created: Tracks the newly added network devices within the past 24 hours.
- Network Devices (KIS): Shows total discovered devices in Kyndryl Inventory Services.
- Network Devices (NIC): Shows total discovered devices in Network Inventory Controller.
- Active Devices: Displays the count of devices currently online and reachable.
- Offline Devices: Lists devices which are inactive.
- Missing Health Details: Identifies devices lacking operational health metric.
- Missing Compliance Data: Highlights devices with unavailable or incomplete compliance information.
The tool tip provides more information about each card.
- Users can use the Search tab to find specific devices by name, model, vendor, or site.
- Users can use the Filter option to narrow down displayed records using specific attributes.
Device inventory breakdown charts
The visual donut and bar charts categorize your total inventory by various attributes:
Chart Name | Chart Type | Key Data Included | Image |
|---|---|---|---|
Device Distribution by Type | Donut Chart | The distribution of devicesacross sites to support capacity planning, operational oversight, and inventory management. For example: Router, Switch, Firewall etc. | 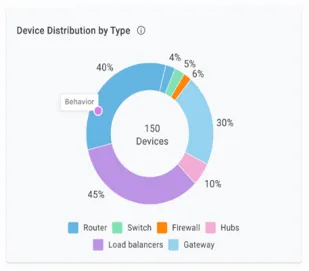 |
Device Distribution by Site | Donut Chart | The distribution of devices across supported network device categories within the inventory. For example: Phoenix-DC, ATL-DC, Remote etc. | 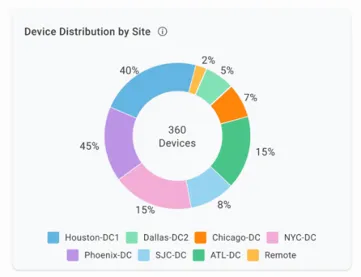 |
Device Distribution by Location | Donut Chart | Visualizes how network devices are distributed across geographic locations, providing visibility into asset deployment and infrastructure coverage across your environment. For example: US-TX, US-NY etc. | 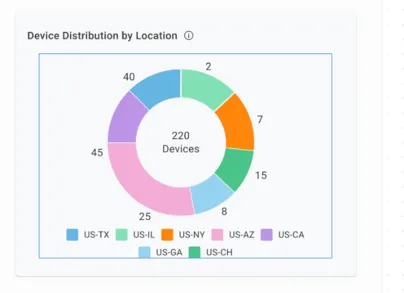 |
Network Vendor Distribution | Horizontal Bar | Shows how network devices are distributed across vendors, providing visibility into infrastructure composition, vendor diversity, and asset coverage across the network environment. For example: Cisco, Juniper, etc. | 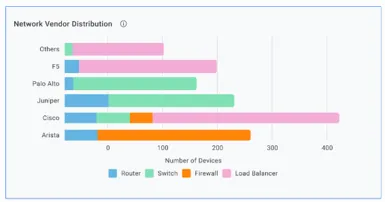 |
Software Version Distribution | Horizontal Bar | The distribution of software versions across devices, providing visibility into version adoption, standardization, and potential upgrade needs across the environment For example: Cisco - IOS-XE 17.9.4 Juniper -Junos 23.2R1 | 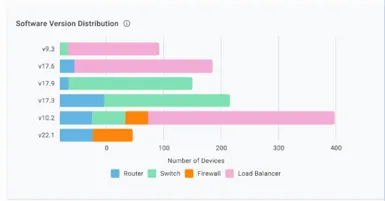 |
Lifecycle and support status tracking
The lower section monitors critical hardware and operating system milestones:
Name | Definition | Examples | Image |
|---|---|---|---|
Hardware End of Life (EOL) Status | The distribution of network devices by hardware lifecycle status, including devices that are supported, nearing End-of-Life (EOL), or past vendor support dates. | Visualizes EOL progress across categories—EOL Reached, EOL Approaching < 90 Days, EOL Approaching < 180 Days, EOL > 180 Days, and EOL Data Not Available. | 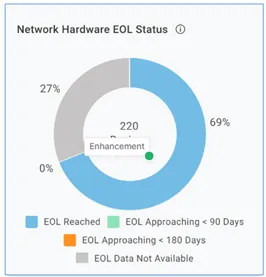 |
Hardware End of Support (EOS) Status | The distribution of network devices by hardware End-of-Support (EOS) status or have exceeded vendor support periods. | Tracks hardware support across categories like EOS Reached, EOS Approaching < 90 Days, EOS Approaching < 180 Days, EOS > 180 Days, and EOS Data Not Available. | 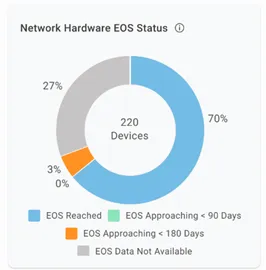 |
Operating System End of Life Status | The Network operating system versions that are supported, nearing End of Life, or no longer receiving vendor support, updates, or maintenance. | Summarizes OS service life cycles indicating EOL Reached, EOL Approaching < 90 Days, EOL >90 Days, and EOL Data Not Available. | 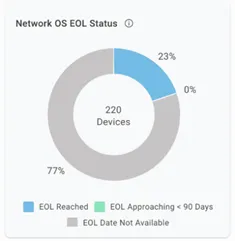 |
Operating System End of Service Status | The Network operating system versions that are supported, nearing End of Service, or no longer receiving vendor support, updates, or maintenance. | Displays OS status breakdowns, indicating EOS Reached, EOS Not Reached, or EOS Data Not Available. | 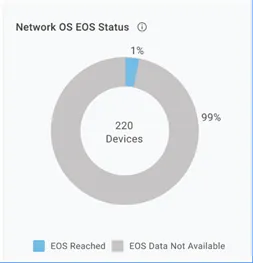 |
| | | |
Data table
The data table view provides detailed list views in the Network Inventory module displays detailed hardware and software specifications for managed network devices, including support lifecycle dates.
- Users can use the Search tab to find specific devices by name, model, vendor, or site.
- Users can use the Filter option to narrow down displayed records using specific attributes.
Inventory data columns
Column Name | Definition |
|---|---|
Hostname | The unique name assigned to a device on the network. |
Vendor | The manufacturer or vendor of the device (for example, Cisco, Juniper, Dell). |
Model | The specific hardware model of the device. |
Site | The site, facility, or location grouping where the device is installed. |
Location | Physical location of the device, such as building, floor, room, or data center. |
OS Version | The version of the operating system currently running on the device. |
HW EOS Date | Hardware End of Support date, after which vendor support for hardware is no longer provided. |
OS EOS Date | Operating System End of Support date, after which support and updates for the OS are no longer available. |
HW EOL Date | Hardware End of Life date, indicating the hardware is no longer sold or officially supported. |
OS EOL Date | Operating System End of Life date, indicating the OS is retired and no longer maintained. |
Date Data Last Collected | The most recent date when inventory or device information was gathered from the device. |
Device Type/Role | The functional role of the device, such as router, switch, firewall, load balancer, or server. |
Serial Number | The manufacturer's unique identifier assigned to the device. |
Firmware Version | The version of firmware currently installed on the device. |
Management IP | The IP address used to manage, monitor, and access the device administratively. |
Refer to the image for more information:
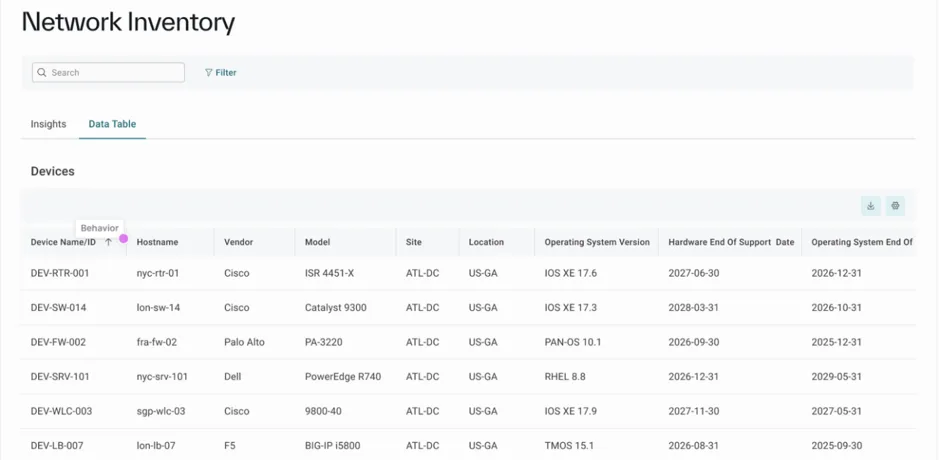
For details refer to End of Life and End of Service Widgets and Network OS Insights WidgetsNetwork.
- End of Life and End of Service Widgets: Ascertain an at-a-glance End of Life and End of Service status for network devices and operating systems.
- Network OS Insights Widgets: Determine mission critical insights into OS hotspots by country and lifecycle status.
- Supported Widgets: Understand the widgets available to you in Network & Edge.
Global Filters
Inventory Managers and Application Owners can refine inventory visualizations using the Inventory Lifecycle global filter.
The Search filter allows to quickly locate specific network devices within the inventory. Enter a Device ID to find matching devices and reduce the time spent navigating large inventories.
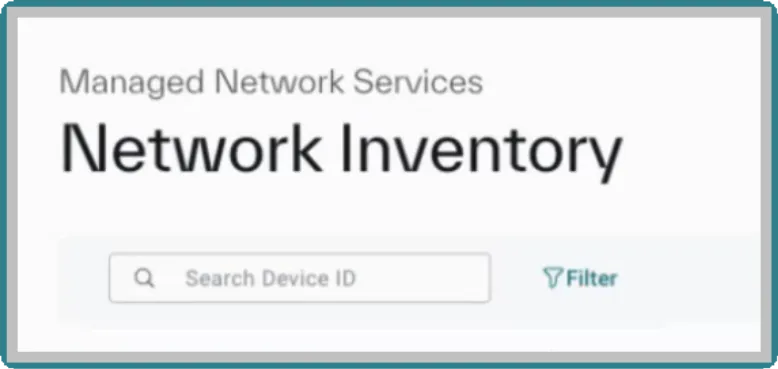
Once the Device ID is entered, the Filter panel displays additional filtering options that allow users to narrow inventory data based on specific criteria.
Applying filters helps users focus on the most relevant inventory information and create more meaningful visualizations for analysis and operational decision-making.
Filter Types
Use the available filters to narrow the inventory results and focus on devices that match specific lifecycle, support and data collection criteria:
Lifecycle Device Status
Use this filter to view devices based on their current lifecycle state within the inventory.
- All: Displays all devices regardless of lifecycle status.
- Active: Displays devices that are currently active and operational.
- Inactive: Displays devices that are no longer active or are not currently in service.
End of Life (EOL) Duration
Use this filter to identify devices according to the time remaining until, or elapsed since, their End of Life (EOL) date, which indicates when the manufacturer no longer provides updates, maintenance or support for the device.
- All: Displays devices regardless of EOL status.
- Reached: Displays devices that have already reached their EOL date.
- Within 90 Days: Displays devices that will reach EOL within the next 90 days.
- Within 90 to 180 Days: Displays devices that will reach EOL within 90 to 180 days.
- Beyond 180 Days: Displays devices with an EOL date more than 180 days away.
- Data Not Available: Displays devices for which EOL information is unavailable.
End of Service (EOS) Duration
Use this filter to identify devices based on their proximity to the End of Service (EOS) date, which indicates when the manufacturer will no longer provide service, maintenance or technical support for the device.
- All: Displays devices regardless of EOS status.
- Reached: Displays devices that have already reached their EOS date.
- Within 90 Days: Displays devices that will reach EOS within the next 90 days.
- Within 90 to 180 Days: Displays devices that will reach EOS within 90 to 180 days.
- Beyond 180 Days: Displays devices with an EOS date more than 180 days away.
- Data Not Available: Displays devices for which EOS information is unavailable.
Date Data Last Collected
Use this filter to focus on devices according to when their inventory data was most recently collected.
- All: Displays devices regardless of the last data collection date.
- Last 24 Hours: Displays devices with data collected within the past 24 hours.
- Last 7 Days: Displays devices with data collected within the past seven days.
- Last 30 Days: Displays devices with data collected within the past 30 days.
Use Clear All to remove all applied filters and restore the default inventory view or select Collapse all items to minimize all filter categories and simplify navigation within the filter panel.