Langfuse for AI Foundation Agent Observability
This system provides observability for agents running through the Agentic AI ecosystem. It enables authorized users to inspect an agent for execution from the initial request through the individual steps performed by the agent.
Langfuse can be used to:
- Troubleshoot failed or unexpected agent executions.
- Identify where an execution experienced an error or delay.
- Understand the sequence of LLM and tool interactions.
- Correlate execution using workflow, agent, deployment and tenant metadata.
- Analyze execution behavior without requiring developers to add Langfuse-specific tracing logic to the agent's business flow.
For an agent execution, you can review:
- Input/request and resulting response
- LLM interactions
- MCP and tool calls
- Intermediate execution steps/spans
- Execution sequence and dependencies
- Latency and duration
- Workflow and execution identifiers
- Agent/deployment and tenant information
- Errors and failed execution steps, where captured
Access and roles
The access is controlled through the existing Kyndryl Bridge AgentOps access groups.
The 2 roles available are:
- AgentOps Admin → Langfuse Admin
- AgentOps Operator → Langfuse Member
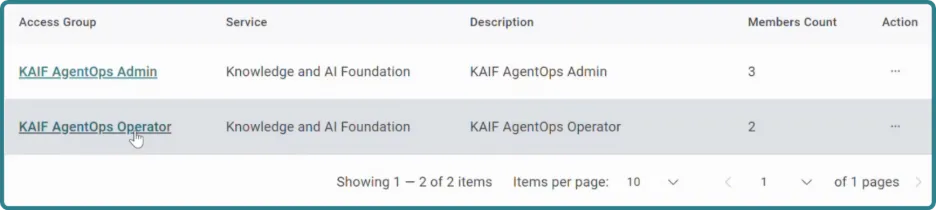
You can only see Langfuse organizations and projects for which you have been authorized. Authentication and role synchronization are handled through the integrated access model.
Tenant and Agent mapping
Langfuse is integrated with the Bridge multi-tenant model:
- Bridge Tenant → Langfuse Organization
- Agent Deployment → Langfuse Project
Execution traces are automatically routed to the corresponding project. This allows you to review telemetry for the relevant tenant and agent deployment without manually creating the Langfuse structure.
To review an Agent execution, follow these steps:
- Login to Langfuse.
- Select and open the organization corresponding to the required Bridge tenant.
- Select the project corresponding to the agent's deployment.
- Open Traces.
- Select the required execution.
- Review the execution using the required view.
- Inspect individual steps to identify LLM calls, MCP/tool activity, latency, inputs/outputs and any execution errors.
Views
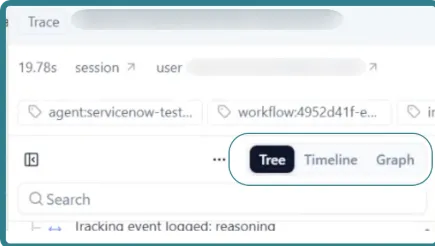
The executed information can be explored through different views: tree, timeline, graph and log.
Known limitations
The current Knowledge & AI Foundation implementation is primarily focused on execution tracing. Capabilities such as evaluation, prompt management, customized operational dashboards, advanced alerting and downstream operational integrations are not delivering functionalities yet.