AIOps Extensions Framework Troubleshooting Guide
Introduction
This guide is designed to help L1 and L2 Support personnel troubleshoot issues with the AIOps Extension and Dashboard problems before creating a SNOW ticket for L3 Developers. The goal is to identify and resolve issues by way of either L1 or L2 support and, failing that, enlist either Development or Platform teams as appropriate.
AIOps relies on data collection extensions to optimize the health and uptime of Network resources and are therefore an integral part of workflows and planning. Kyndryl has therefore implemented incident management and ticketing systems to notify support personnel of when data collection extensions fail.
Using this guide, support personnel can perform procedures specific to individual extensions and understand when to escalate the issue at hand.
Key components of the manual
- Architecture Overview: Visual diagrams explaining how Producer Extensions, Synapps Messaging, Consumer Extensions and Kibana Dashboards interact within the AKS environment.
- Dashboard Troubleshooting: Detailed procedures for addressing:
- Missing data issues
- Stale data problems
- Data inconsistencies
- Complete troubleshooting flow chart for efficient issue identification
- Producer Extensions Troubleshooting:
- Checking pod status and logs
- Addressing authentication issues
- Resolving external connectivity problems
- Verifying successful data transmission to Synapps
- Consumer Extensions Troubleshooting:
- Diagnosing message processing errors
- Checking Elasticsearch connectivity
- Resolving index mapping conflicts
- Monitoring consumer group lag
- Clear Escalation Guidelines:
- Specific criteria for when to escalate to L3 Developers
- When to route issues to Platform teams instead
- Azure Kubernetes Service Commands: AKS-specific kubectl commands for:
- Pod status monitoring
- Resource usage tracking
- Configuration management
- Network diagnostics
- Specific Elasticsearch and Synapps (Kafka) troubleshooting
Architecture overview
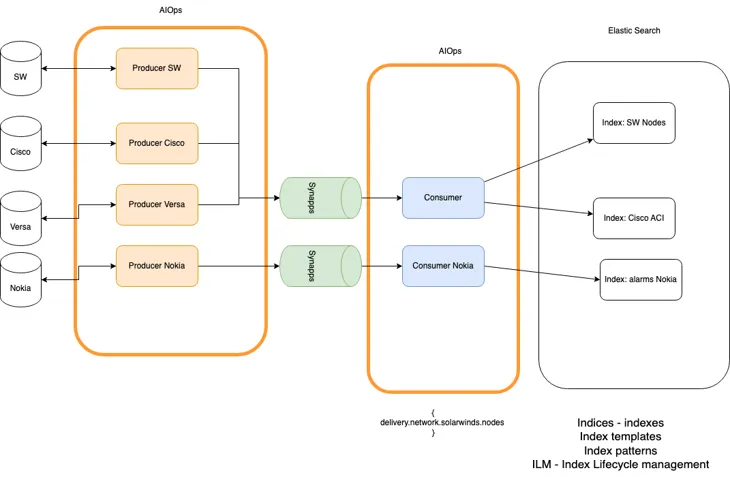
The AIOps platform uses an Extensions framework to integrate with external systems. There are two types of Extensions:
- Producer Extensions: Pull data from external systems and push it to Synapps topics
- Consumer Extensions: Pull data from Synapps topics and push it to Elasticsearch indices
The data is then visualized through Kibana dashboards.
Common issue categories
Issues can generally be categorized as:
- Dashboard Issues: Problems with data visualization in Kibana
- Producer Extension Issues: Problems with collecting data from external systems
- Consumer Extension Issues: Problems with processing data and storing in Elasticsearch
- Platform Issues: Problems with underlying platform services (Synapps, Elasticsearch, Kubernetes, IAM, Vault, etc.)
Dashboard-related issues
Dashboard issues are often the first problems reported by users. These typically manifest as missing data, stale data, or data that does not add up correctly.
Missing data troubleshooting flow
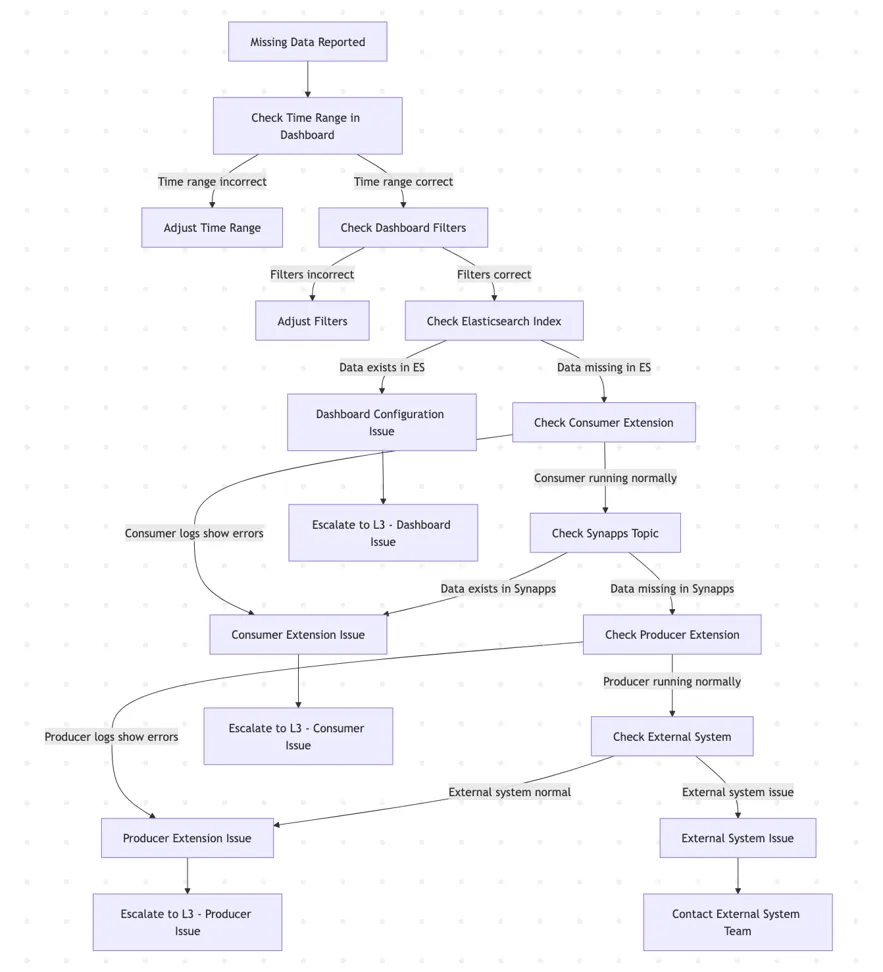
Note: In the case of a consumer extension failure, restart the consumer extension. If the problem persists, escalate to L3.
Step 1: Verify Dashboard Configuration
- Check Time Range
- Ensure the dashboard is set to the correct time range
- Try expanding the time range to see if data appears
- Check Filters
- Verify that no filters are inadvertently excluding data
- Reset all filters and see if data appears
- Check Index Pattern
- Verify the dashboard is using the correct index pattern
- Command to check available indices:
kubectl exec -it $(kubectl get pods -n elasticsearch -l app=elasticsearch -o name | head -1) -n elasticsearch -- curl -s 'localhost:9200/_cat/indices?v'
Step 2: Check Elasticsearch Data
- Check if data exists in the Elasticsearch index
kubectl exec -it $(kubectl get pods -n elasticsearch -l app=elasticsearch -o name | head -1) -n elasticsearch -- curl -s 'localhost:9200/index-name/_search?size=1&pretty'
- Check index mapping
kubectl exec -it $(kubectl get pods -n elasticsearch -l app=elasticsearch -o name | head -1) -n elasticsearch -- curl -s 'localhost:9200/index-name/_mapping?pretty'
- Check document count
kubectl exec -it $(kubectl get pods -n elasticsearch -l app=elasticsearch -o name | head -1) -n elasticsearch -- curl -s 'localhost:9200/index-name/_count?pretty'
Step 3: Stale Data Issues
- Check the last updated timestamp in the index
kubectl exec -it $(kubectl get pods -n elasticsearch -l app=elasticsearch -o name | head -1) -n elasticsearch -- curl -s 'localhost:9200/index-name/_search?sort=@timestamp:desc&size=1&pretty'
- Verify Consumer Extension schedule: Check the consumer extension logs for scheduled runs
kubectl logs -n extensions $(kubectl get pods -n extensions -l app=consumer-extension-name -o name | head -1) --tail=100
Step 4: Data Consistency Issues
If data does not add up correctly:
- Check for duplicate data
- Look for duplicate entries in Elasticsearch
- Check if the consumer extension is properly handling deduplication
- Check aggregation settings
- Verify that dashboard aggregations are configured correctly
- Ensure the proper time field is being used for time-based aggregations
Producer Extensions Issues
Step 1: Check Producer Extension Status
- Check if the producer pods are running
kubectl get pods -n extensions -l app=producer-extension-name
- Check the producer extension logs
kubectl logs -n extensions $(kubectl get pods -n extensions -l app=producer-extension-name -o name | head -1) --tail=100
- Check pod resource usage
kubectl top pod -n extensions $(kubectl get pods -n extensions -l app=producer-extension-name -o name | cut -d/ -f2)
Step 2: Common Producer Extension Issues
- Authentication Issues
- Look for authentication errors in logs
- Verify IAM/Vault integration is working
- Check if credentials need to be updated
# Check if extension can access vault
kubectl exec -it -n extensions $(kubectl get pods -n extensions -l app=producer-extension-name -o name | head -1) -- curl -s http://vault.vault-namespace:8200/v1/health
- Connection Issues
- Look for timeout or connection errors in logs
- Check network connectivity to external system
- Verify external system is operational
- Rate Limiting
- Check for rate limiting errors in logs
- Verify rate limit configuration in extension
- Data Format Changes
- Look for parsing errors in logs
- Check if external API has changed format
Step 3: Producer to environment Integration
- Check if producer is successfully sending to your environment
- Look for successful message publishing logs
- Check environment topic status
kubectl exec -it -n namespace $(kubectl get pods -n synapps -l app=synapps-admin -o name | head -1) -- bin/kafka-topics.sh --describe --topic topic-name --bootstrap-server synapps:9092
- Check message count in environment topic
kubectl exec -it -n namespace $(kubectl get pods -n synapps -l app=synapps-admin -o name | head -1) -- bin/kafka-run-class.sh kafka.tools.GetOffsetShell --broker-list synapps:9092 --topic topic-name
Note: The example commands uses the variable namespace as a placeholder for the environment namespace. Insert your environment namespace in place of the placeholder.
Consumer Extensions Issues
Step 1: Check Consumer Extension Status
- Check if the consumer pods are running
kubectl get pods -n extensions -l app=consumer-extension-name
- Check the consumer extension logs
kubectl logs -n extensions $(kubectl get pods -n extensions -l app=consumer-extension-name -o name | head -1) --tail=100
- Check pod resource usage
kubectl top pod -n extensions $(kubectl get pods -n extensions -l app=consumer-extension-name -o name | cut -d/ -f2)
Step 2: Common Consumer Extension Issues
If logs have not been recently populated, restart the consumer and revalidate the logs. If necessary, repeat the restart up to three times with a delay of 15 minutes between restarts. When logs have been populated, perform the following procedure.
- Message Processing Errors
- Look for deserialization or processing errors in logs
- Check if schema validation is failing
- Elasticsearch Connection Issues
- Look for Elasticsearch connection errors
- Check if Elasticsearch is accessible from consumer pods
kubectl exec -it -n extensions $(kubectl get pods -n extensions -l app=consumer-extension-name -o name | head -1) -- curl -s elasticsearch.elasticsearch-namespace:9200
- Index Mapping Conflicts
- Look for field mapping errors in logs
- Check if new fields are causing mapping issues
- Consumer Group Issues
- Check consumer group status
kubectl exec -it -n synapps $(kubectl get pods -n synapps -l app=synapps-admin -o name | head -1) -- bin/kafka-consumer-groups.sh --describe --group consumer-group-name --bootstrap-server synapps:9092
Step 3: Synapps to Consumer Integration
- Check if consumer is successfully reading from Synapps
- Look for message consumption logs
- Check if messages are being processed but failing to index
- Look for Elasticsearch indexing errors
- Check consumer lag
kubectl exec -it -n synapps $(kubectl get pods -n synapps -l app=synapps-admin -o name | head -1) -- bin/kafka-consumer-groups.sh --bootstrap-server synapps:9092 --describe --group consumer-group-name
When to Escalate to L3 Developers
Escalate to L3 Developers ONLY when:
- Confirmed Code Bugs:
- Reproducible extension failures with clear error logs
- Incorrect data transformation logic
- Parsing errors due to incorrect code logic
- Schema validation failures due to code issues
- Dashboard Development Issues:
- Dashboard visualization errors (when data exists in Elasticsearch)
- Incorrect aggregations or calculations in dashboards
- Missing fields in visualizations when fields exist in Elasticsearch
- Extension Performance Issues:
- Slow data processing not related to infrastructure
- Memory leaks in extension code
- High CPU usage due to inefficient algorithms
Important: Before escalation, gather the following information:
- Detailed error logs
- Reproduction steps
- Time window of the issue
- Specific data samples showing the issue
- Screenshots of dashboard issues
- All troubleshooting steps already performed
When to Escalate to Platform Teams
Escalate to Platform Teams when:
- Synapps Issues:
- Synapps cluster unavailability
- Topic configuration issues
- Message retention issues
- Performance problems with Synapps
- Elasticsearch Issues:
- Elasticsearch cluster unavailability
- Index capacity issues
- Elasticsearch performance problems
- Shard allocation issues
- AKS/Kubernetes Issues:
- Node failures
- Pod scheduling issues
- Network connectivity between services
- Resource constraints at the cluster level
- IAM/Vault Issues:
- Authentication service unavailability
- Token expiration issues
- Secret access problems
- Role permission issues
Appendix: Useful kubectl Commands
Pod Status Commands
# Get all pods in extensions namespace
kubectl get pods -n extensions
# Get detailed information about a specific pod
kubectl describe pod [pod-name] -n extensions
# Get logs from a specific pod
kubectl logs [pod-name] -n extensions
# Get logs from previous instance of a pod (if it restarted)
kubectl logs [pod-name] -n extensions --previous
# Watch pod status in real-time
kubectl get pods -n extensions -w
Resource Usage Commands
# Get CPU and memory usage for all pods
kubectl top pods -n extensions
# Get CPU and memory usage for nodes
kubectl top nodes
Configuration Commands
# Check ConfigMaps used by extensions
kubectl get configmaps -n extensions
# View a specific ConfigMap
kubectl describe configmap [configmap-name] -n extensions
# Check Secrets used by extensions
kubectl get secrets -n extensions
# Check service accounts
kubectl get serviceaccounts -n extensions
Network Commands
# Check services in the extensions namespace
kubectl get services -n extensions
# Describe a service to see endpoints
kubectl describe service [service-name] -n extensions
# Test network connectivity from a pod
kubectl exec -it [pod-name] -n extensions -- curl -v [service-url]
# Check DNS resolution from a pod
kubectl exec -it [pod-name] -n extensions -- nslookup [service-name]
Troubleshooting Extensions
# Check events related to a pod
kubectl get events -n extensions --field-selector involvedObject.name=[pod-name]
# Get a shell in a pod for advanced troubleshooting
kubectl exec -it [pod-name] -n extensions -- /bin/
# Check environment variables in a pod
kubectl exec [pod-name] -n extensions -- env
# files from a pod for inspection
kubectl cp [pod-name]:/path/to/file /local/path -n extensions
Elasticsearch Specific Commands
# Check Elasticsearch cluster health
kubectl exec -it $(kubectl get pods -n elasticsearch -l app=elasticsearch -o name | head -1) -n elasticsearch -- curl -s 'localhost:9200/_cluster/health?pretty'
# List all indices
kubectl exec -it $(kubectl get pods -n elasticsearch -l app=elasticsearch -o name | head -1) -n elasticsearch -- curl -s 'localhost:9200/_cat/indices?v'
# Check index settings
kubectl exec -it $(kubectl get pods -n el curl -s 'localhost:9200/[index-name]/_settings?pretty'
Synapps (Kafka) Specific Commands
asticsearch -l app=elasticsearch -o name | head -1) -n elasticsearch --
# List all topics
kubectl exec -it -n synapps $(kubectl get pods -n synapps -l app=synapps-admin -o name | head -1) -- bin/kafka-topics.sh --list --bootstrap-server synapps:9092
# Describe a topic
kubectl exec -it -n synapps $(kubectl get pods -n synapps -l app=synapps-admin -o name | head -1) -- bin/kafka-topics.sh --describe --topic [topic-name] --bootstrap-server synapps:9092
# Check consumer groups
kubectl exec -it -n synapps $(kubectl get pods -n synapps -l app=synapps-admin -o name | head -1) -- bin/kafka-consumer-groups.sh --list --bootstrap-server synapps:9092